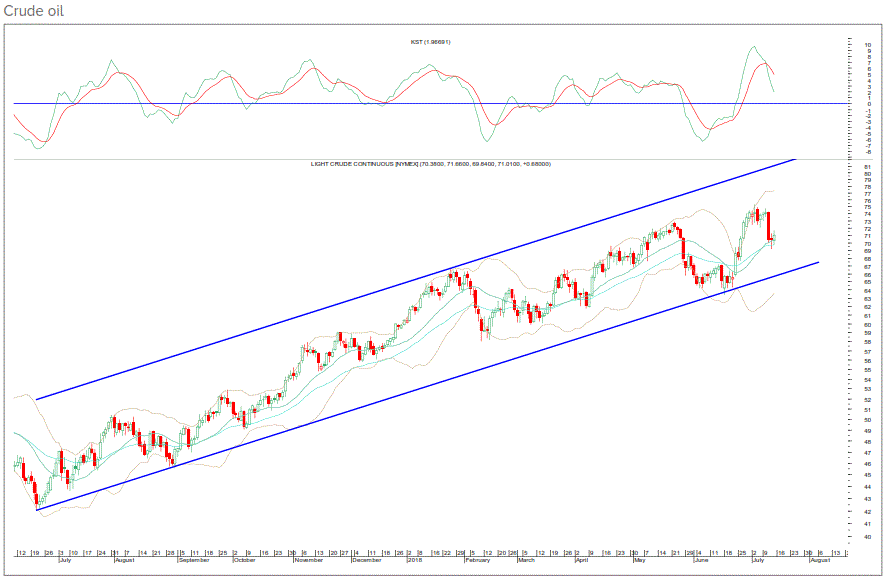
NYMEX Crude Oil retraced in last week’s trade but overall chart structure indicates buy on dips. On the daily charts, it took support on the 20 DMA and is moving higher. On the way up, it is likely to inch higher towards the upper end of the channel which is currently pegged at 79. On the way down, 68 will be a crucial support zone in the near term, which is 61.8% of the recent rise. A pullback towards the support zone can be considered as a buying opportunity. The daily momentum indicator is negative but weekly the momentum indicator is still in the positive mode.

