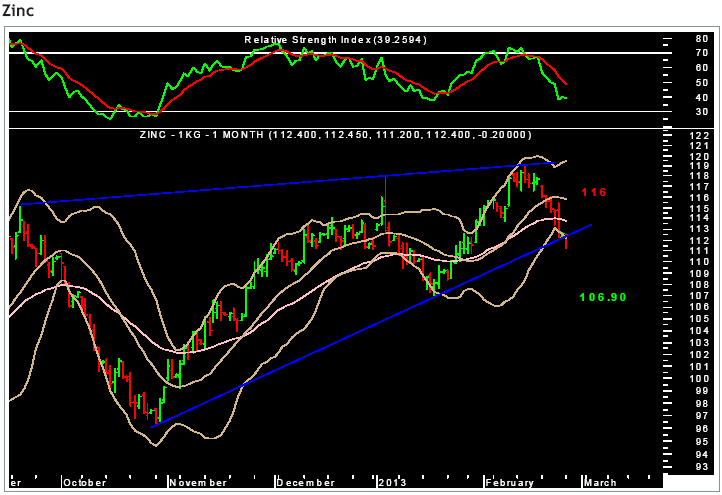
As can be seen from the chart, MCX zinc has formed a large wedge pattern, which is a bearish pattern in this particular case. The pattern looks complete at the high of 119.10 from where the commodity has started falling down. The daily momentum indicator is in line with the price fall. Zinc has reached the lower end of the pattern.A minor-degree bounce from the current level should be used as a selling opportunity. The fresh short position can be initiated near 114 with reversal above the 20-daily moving average, ie 116 on a closing basis. The short-term target on the downside is at 106.90.
Tags
Zinc

